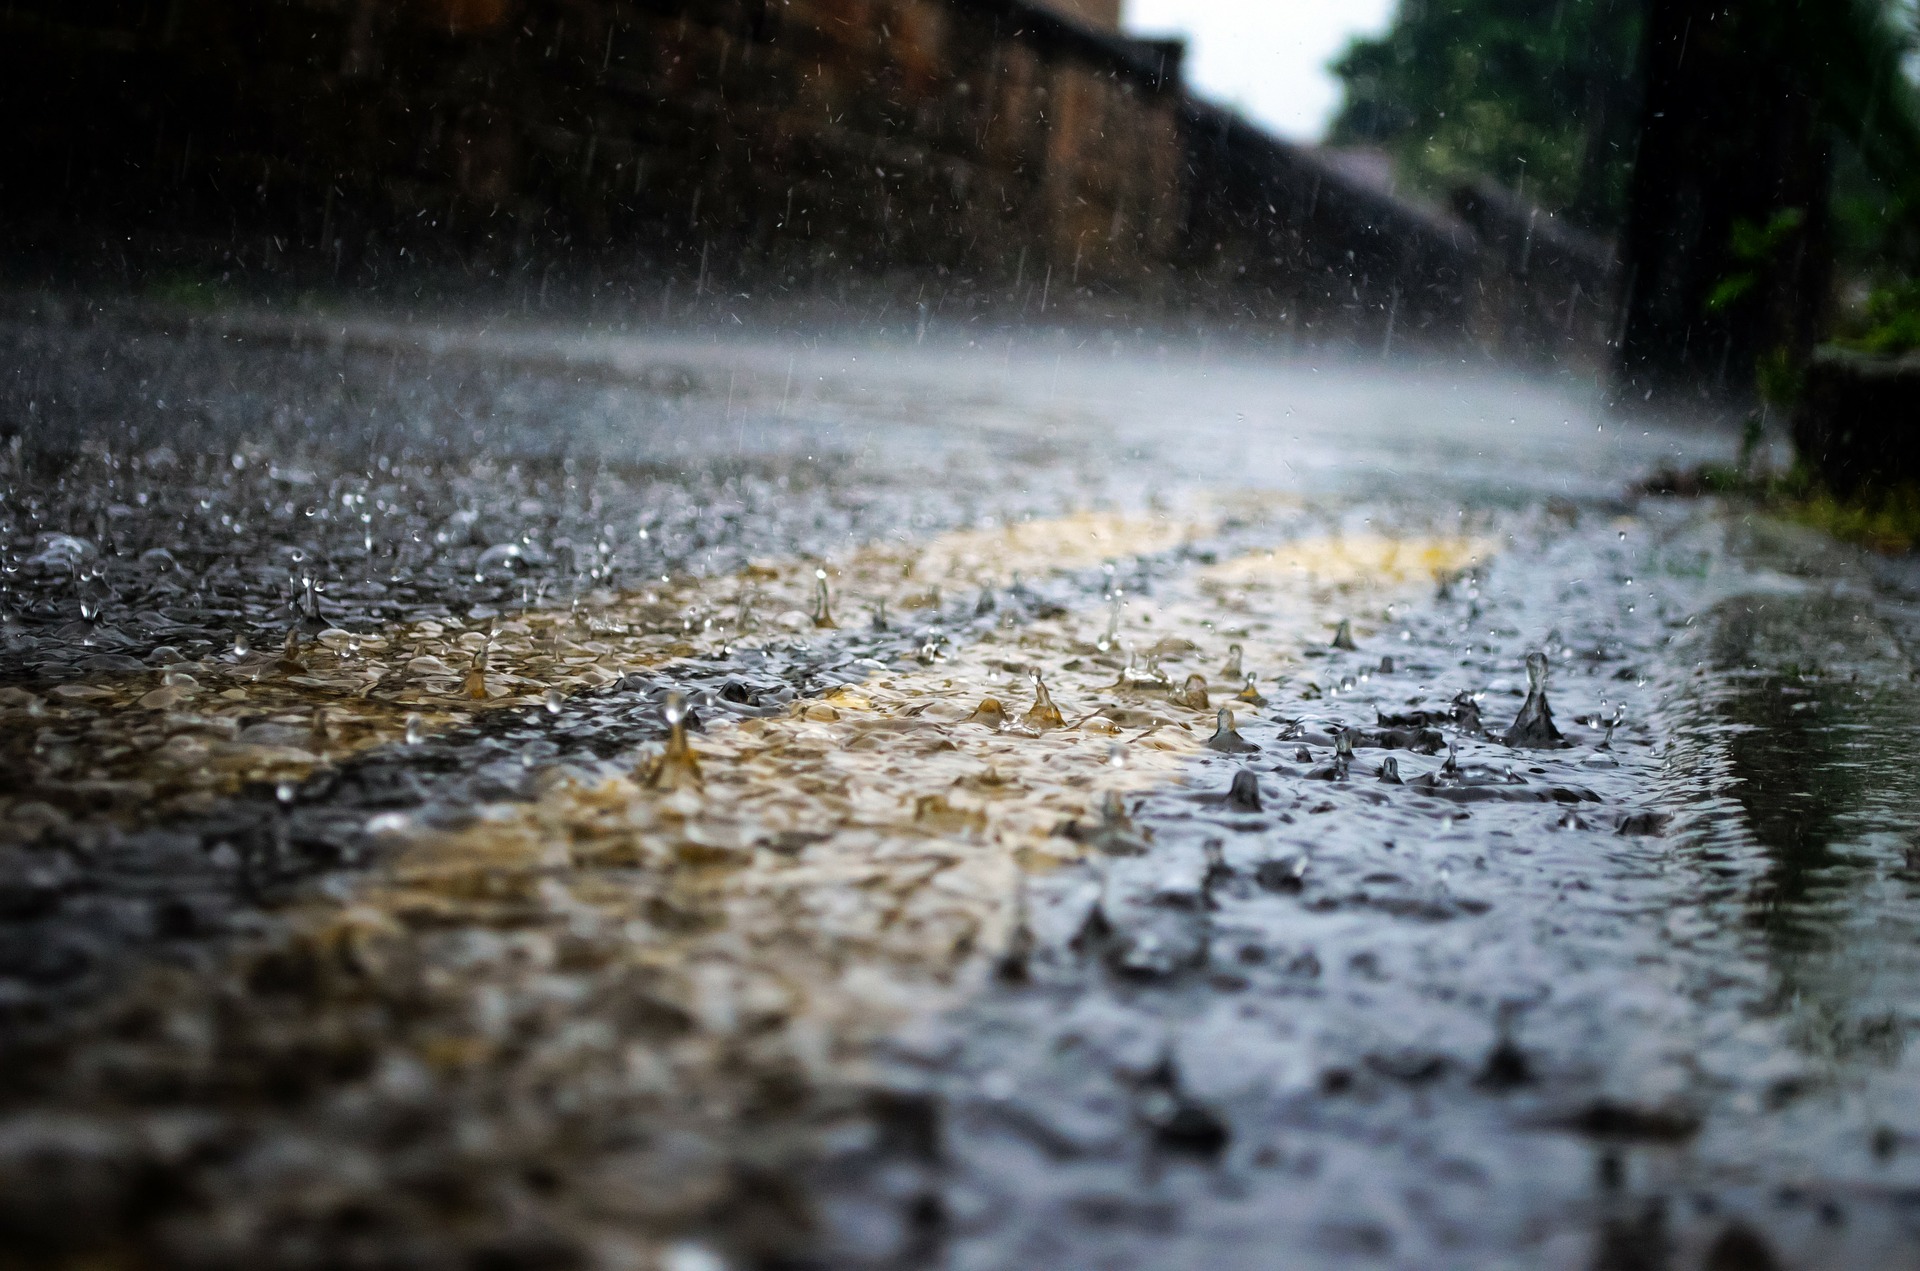
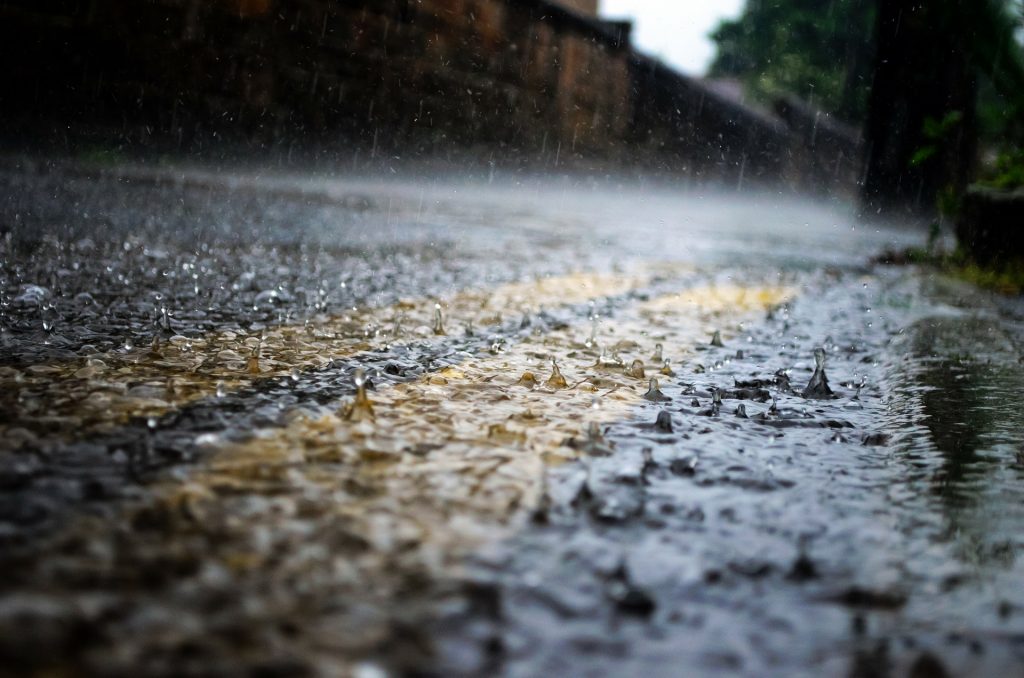
The continental United States gets an average of 30 inches of precipitation each year. With all of the water falling from the sky, you might be wondering if rainwater is safe to drink. While using rainwater is a great way to conserve resources, some sources state that rainwater might not be the best source for drinking water. Depending on how the water is collected, it could contain dangerous contaminants.
We decided to test some rainwater samples in this month’s science experiment for kids. We’ll compare our rainwater samples to regular tap water and filtered tap water to see how they compare. Before you can perform this experiment, you’ll need to collect some rainwater samples. We had samples from four different rainfalls for our tests. You will also need a School and Science Fair Test Kit from TestAssured which has all the tools and equipment that you will need to perform the water tests.
Supplies
The first thing you need to do is gather your supplies:
- Test Assured 4 Test Kit Set with TDS Meter
- 4 cups
- Rainwater samples
- Drinking water samples for comparison
Preparation
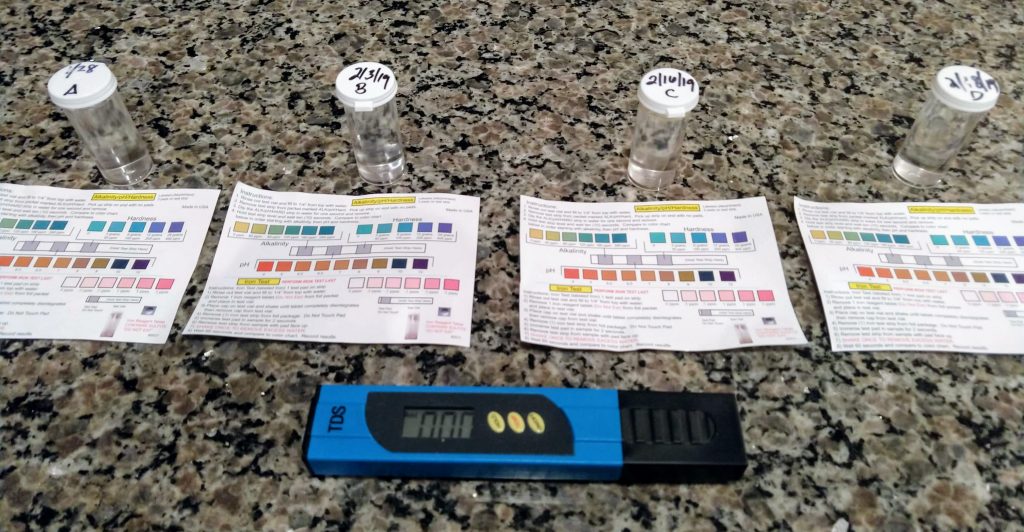
To prepare for the tests, you’ll need to gather your water samples. We left a clean dry bowl outside each time it rained in the weeks before we performed the test. It’s springtime in South Carolina, so we didn’t have to wait long to collect our samples. Each time we had collected some rainwater in our bowl, we poured it into one of the test vials from the School and Science Fair Test Kit. We labeled the vials with the date and noted anything important in the samples results notebook. For example, our sample from 2/16/19 had a layer of yellow pollen floating on top, so we made a note of that in case it impacted our tests. You can also store your water samples in plastic ziplock bags, but don’t forget to label the bags with a permanent marker.
Before you start testing, we recommend that you have some control samples of drinking water that you can use for comparison. We used tap water and filtered water, but bottled water or distilled water would also be great options.
Testing
First, you will start with the test for total dissolved solids, using the TDS meter. Because the meter will not fit in the test vials, you will need to transfer your samples into larger containers for this part of the experiment. We found that plastic cups work very well for the TDS testing. To perform the TDS test, simply turn on the meter and submerge the prongs in the samples. Rinse the meter with clean water between each test. Record your results in the results notebook. Be sure to read the TDS meter carefully. High readings will be noted with “x10.” 
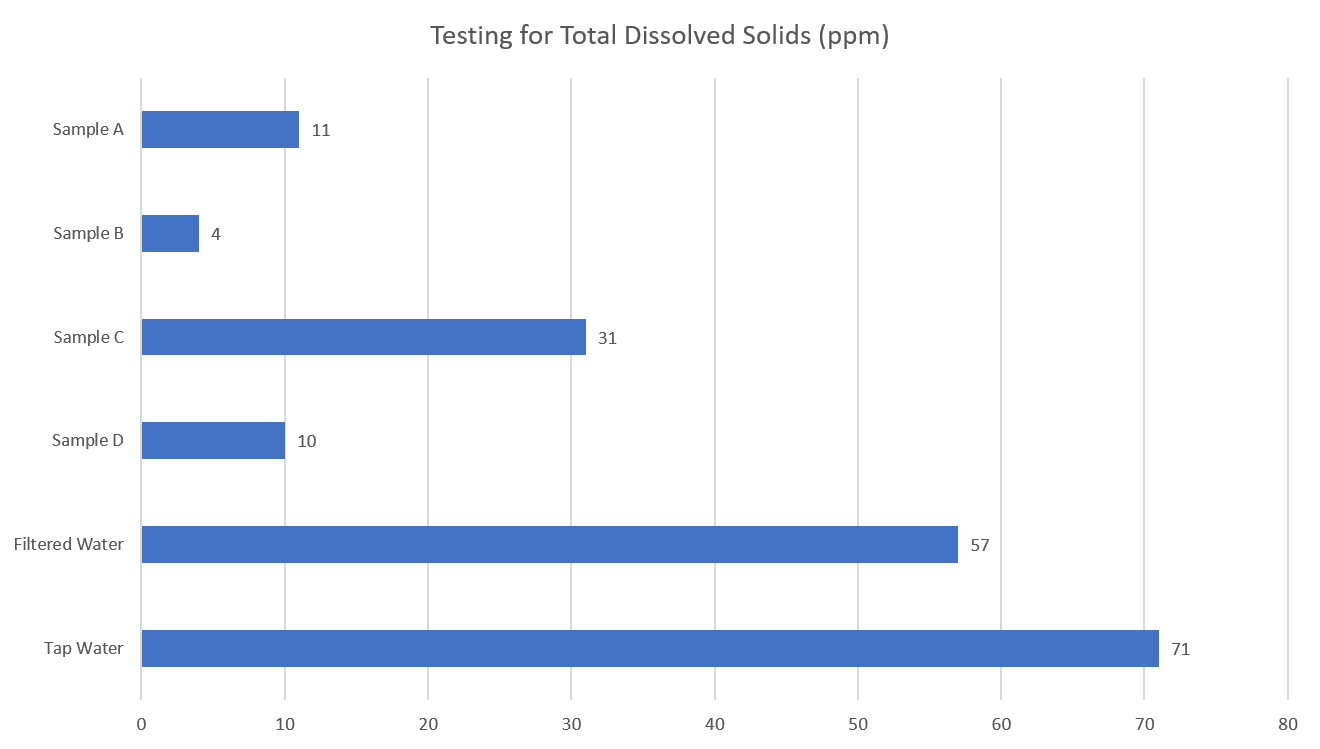
We weren’t surprised to find that Sample C, the one with the pollen, had a higher TDS reading than our other rainwater samples. Our control samples had the highest TDS readings.
After completing the TDS test, you will need to pour your samples back into the vials you labeled. Do this over a sink and be sure to wipe up any spills, so you don’t contaminate the test strips. Now you’re ready to get started with the rest of the tests. It’s easiest to work with one sample at a time. Follow these instructions to complete the remaining tests.
Alkalinity/pH/Hardness Test
- Remove the test strip from the packet labeled, “ALK/pH/Hard”
- Pick up the strip on the end with no pads
- Dip the strip in the sample for one second and remove
- Hold the test strip level and wait 10 seconds
- Place the strip as shown in the picture and compare to the color chart for alkalinity, pH, and harness
- Record your results in the results notebook
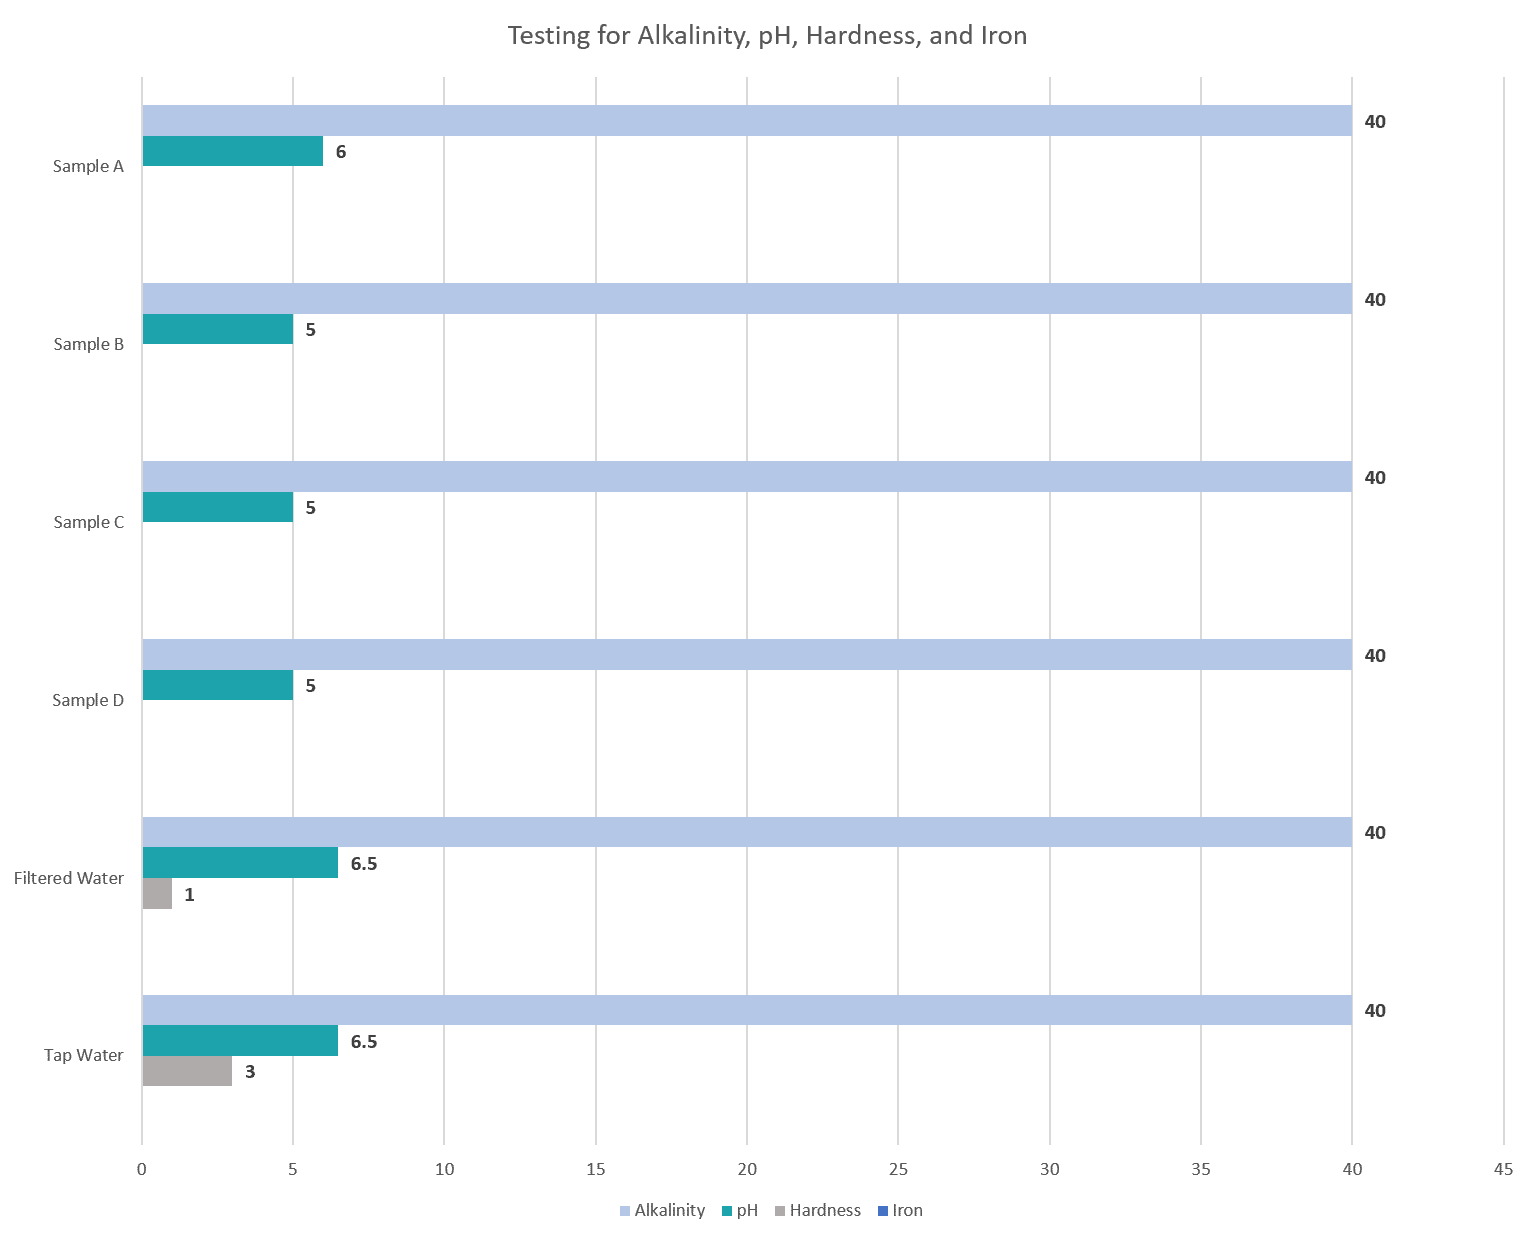
There wasn’t much variation among our rainwater samples for this set of tests. The biggest difference was that the pH of rainwater was a little lower than our control samples.
Total Chlorine/Copper/Nitrate/Nitrite Test
- Remove the test strip from the packet labeled, “CL/CO/NA/NI”
- Pick up the strip on the end with no pads
- Dip the strip in the sample three times and remove – DO NOT SHAKE OFF EXCESS WATER
- Hold the test strip level for 2 seconds
- Place the strip as shown in the picture and compare to the color chart for chlorine and copper
- Wait 45 seconds before reading the results for nitrate and nitrite
- Record your results in the results notebook
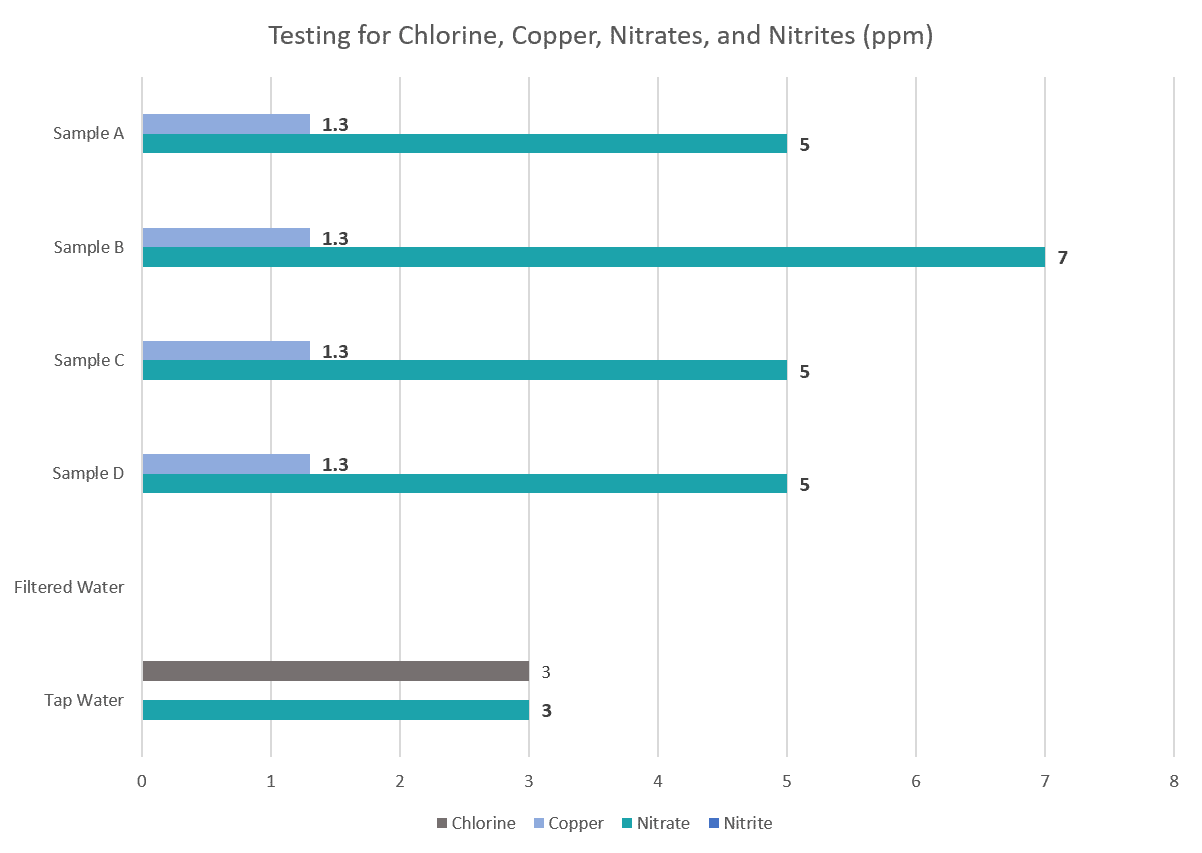
For this set of tests, none of our samples contained any iron or nitrites. Our filtered water actually did not contain any contaminants. We did see some variation in our samples for nitrates. We also found that the rainwater samples contained a trace amount of copper that was not found in the control samples.
Iron Test (Complete this test last)
- Remove one iron reagent tablet from the foil packet and place in test vial (the reagent could alter the results of other tests which is why the iron test is completed last)
- Place the cap on the test vial and shake for approximately one minute, until the tablet is completely dissolved
- Remove the test strip from the packet labeled, “Iron Test”
- Dip the strip in the sample for 2 seconds
- Shake the strip once and wait 60 seconds
- Place the strip as shown in the picture and compare to the color chart for iron
- Record your results in the results notebook
None of our samples contained any iron.
Repeat all three tests for each of your samples. Make sure you wash your hands with soap and water when you are finished.
Results
Now that you have completed each of the tests on your four rainwater samples and your control samples, it’s time to look at your results. Ask yourself these questions:
- Did the different rainwater samples vary compared to each other?
- How did the rainwater samples differ from your control samples?
- Do you think that rainwater is safe to drink?
- What results did you find the most surprising?
Record your answers on the “Notes” page.
If you are doing a science project, be sure to create some graphs and charts to display your results. You can also use clear tape to fix the test sticks to the color charts as another way to show your results.