
With all of the scares about water quality and safety, there are a number of ways you can reduce your risk of drinking contaminated water. One of the cautions we have heard recently is that the quality of your municipal water can change depending on the time of day.
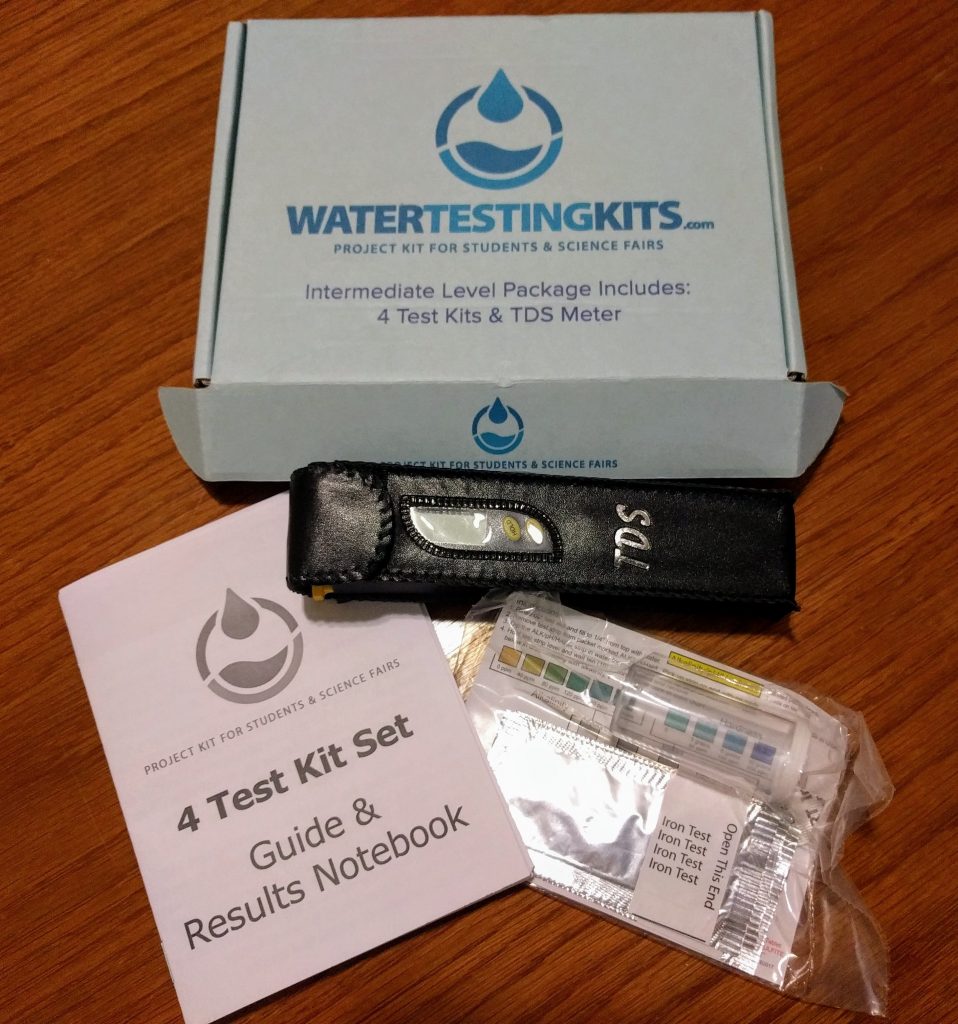
We decided to put this theory to the test by analyzing samples gathered at different times during the day. To do this, we used TestAssured’s 4 Test Kit Set for Schools and Science Fairs. This set includes 4 test kits and can be used by children in grades three through twelve to perform simple science experiments like this one.
Supplies
The first thing you need to do is gather your supplies:
- Test Assured 4 Test Kit Set with TD Meter
- Tap water
- Paper towels
Preparation
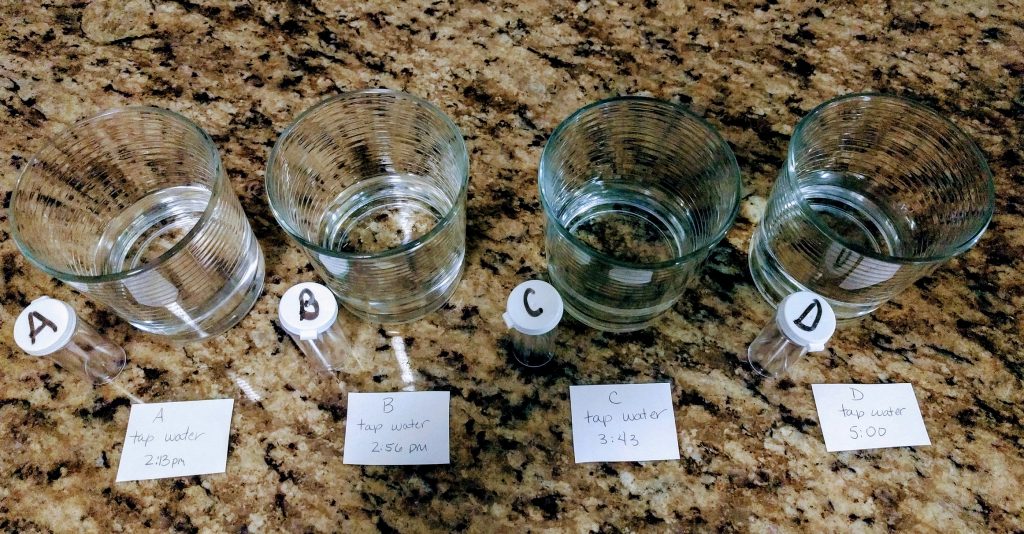
Before you start testing, you’ll need to gather your water samples. We collected four different samples throughout the day, noting the time each was collected. It is recommended that your sample be at least ½ cup in order to have enough liquid to perform the TDS test. Collect your samples in a mug or glass and set aside to complete the TDS test before pouring samples into the vials.
Testing
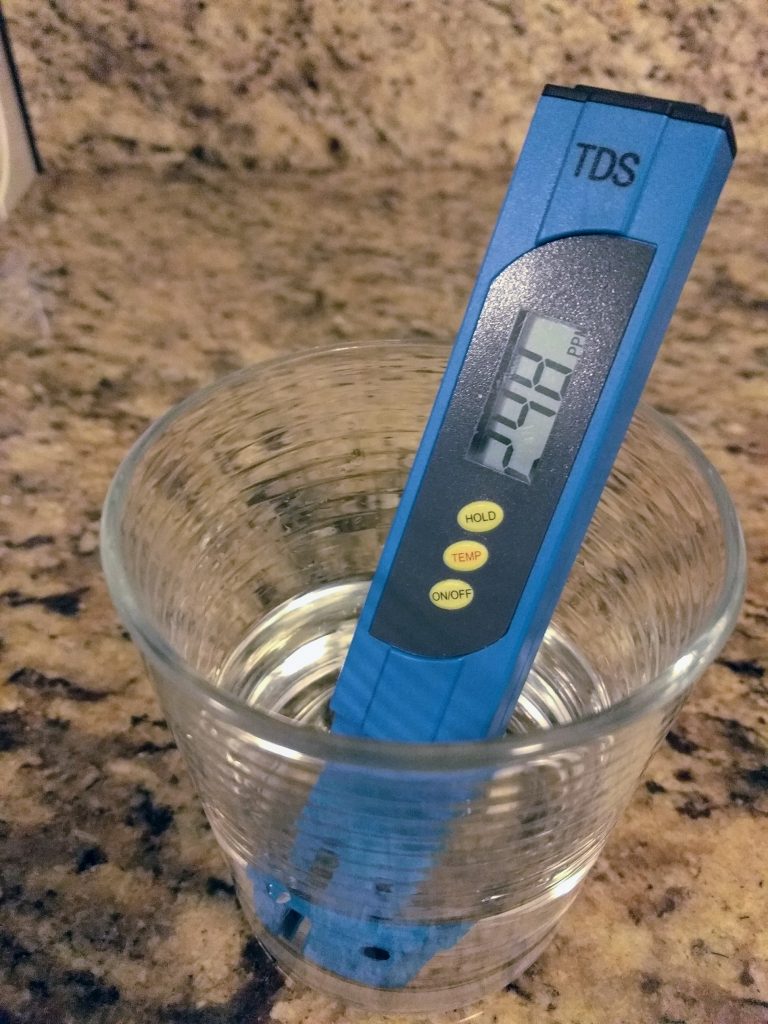
The first test you want to start with is for total dissolved solids, using the TDS meter. The meter will not fit in the test vials, so it is easier to complete this part of the experiment before transferring your samples to the vials. To perform the TDS test, simply turn on the meter and submerge the prongs in the samples. Rinse the meter with clean water and pat dry between each test. Record your results in the results notebook.
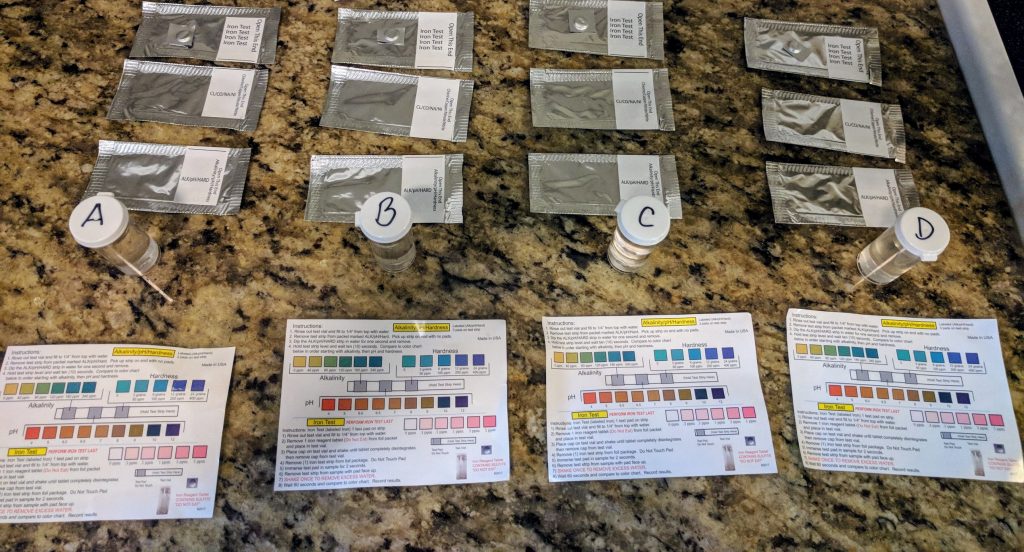
After completing the TDS test, you will need to pour your samples into the vials you labeled. Fill each vial to within a ¼” of the top. Be sure to wipe up any spills, so you don’t contaminate the test strips.
Before you get started with the tests, now is a good time to make some visual observations. You may notice that some of the samples are cloudy or contain particles. These observations can be written in the “Notes” on the last page of the results notebook.
Now you’re ready to get started with the rest of the tests. Follow these instructions to complete the remaining tests.
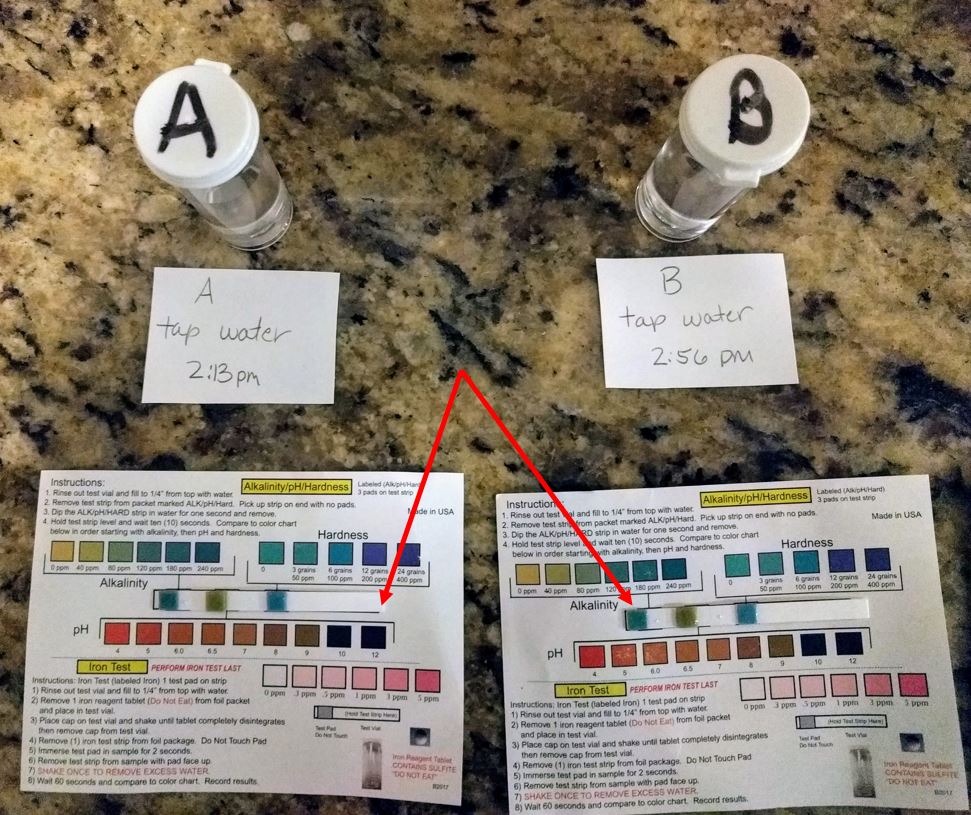
Alkalinity/pH/Hardness Test
- Remove the test strip from the packet labeled, “ALK/pH/Hard”
- Pick up the strip on the end with no pads
- Dip the strip in the sample for one second and remove
- Hold the test strip level and wait 10 seconds
- Place the strip as shown in the picture and compare to the color chart for alkalinity, pH, and hardness
- Record your results in the results notebook
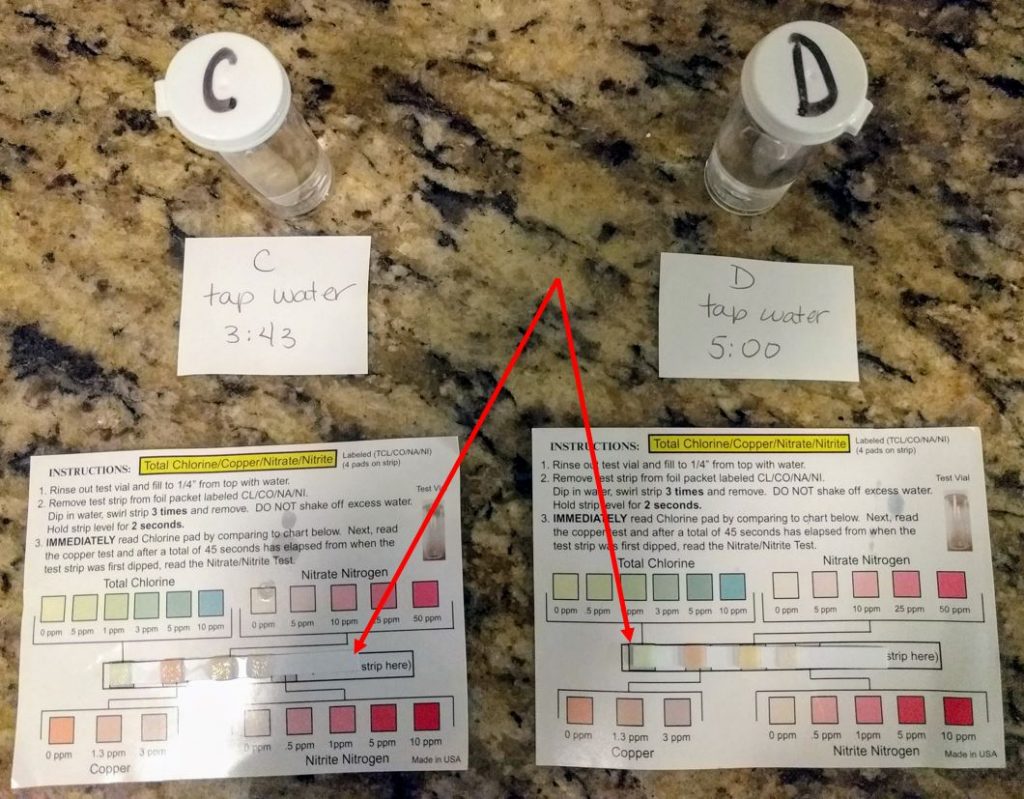
Total Chlorine/Copper/Nitrate/Nitrite Test
- Remove the test strip from the packet labeled, “CL/CO/NA/NI”
- Pick up the strip on the end with no pads
- Dip the strip in the sample three times and remove – DO NOT SHAKE OFF EXCESS WATER
- Hold the test strip level for 2 seconds
- Place the strip as shown in the picture and compare to the color chart for chlorine and copper
- Wait 45 seconds before reading the results for nitrate and nitrite
- Record your results in the results notebook
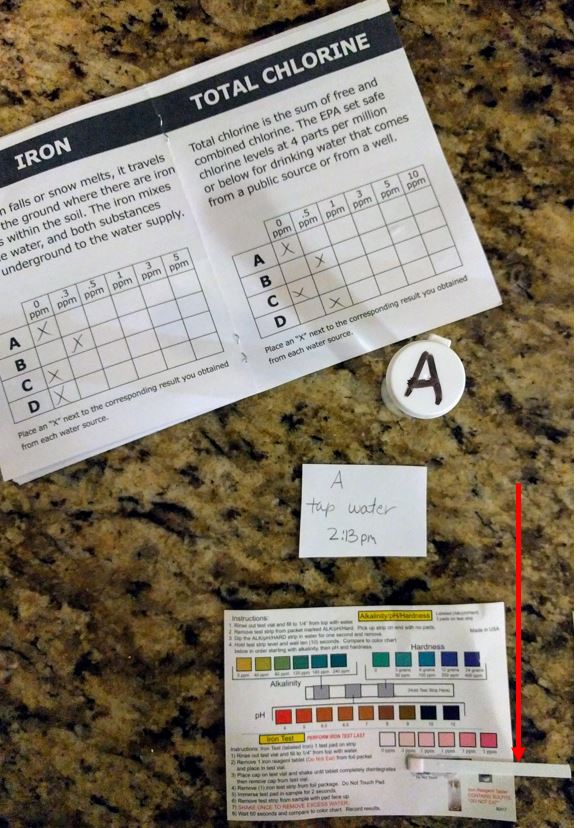
Iron Test (Complete this test last)
- Remove one iron reagent tablet from the foil packet and place in test vial (the reagent could alter the results of other tests which is why the iron test is completed last)
- Place the cap on the test vial and shake for approximately one minute, until the tablet is completely dissolved
- Remove the test strip from the packet labeled, “Iron Test”
- Dip the strip in the sample for 2 seconds
- Shake the strip once and wait 60 seconds
- Place the strip as shown in the picture and compare to the color chart for iron
- Record your results in the results notebook
Repeat all three tests for each of your samples.
Results
Now that you have completed each of the four tests on your samples, it’s time to look at your results. Ask yourself these questions:
- Was there a significant difference in quality among the samples?
- Could you determine if there was a best time of day to drink your tap water?
- What results did you find the most surprising?
Record your answers on the “Notes” page. If you are using this as a science fair project, you can use clear tape to fix the test sticks to the color charts to display your results. You may even want to create some graphs or charts from your results.